The report (Overview tab)
A staff list's Overview tab is the report: everything the HTML report and the PowerPoint deck contain, on one page. It's built from the staff list's cached summary, so it loads instantly and still works after the engagement's personal data has been purged.
Renaming a staff list
A staff list takes its name from the upload. Leads and analysts can change it while the engagement is active: choose Rename at the top right of the staff list (below the title on a phone), type the new name and choose Save name. The new name appears across the engagement and in exports made from then on; files already downloaded keep the old one. An AI-written executive summary quotes the name, so renaming clears it and the Overview shows the rule-based summary until someone generates it again. The rename is recorded in the audit trail as Renamed staff list.
What the report shows
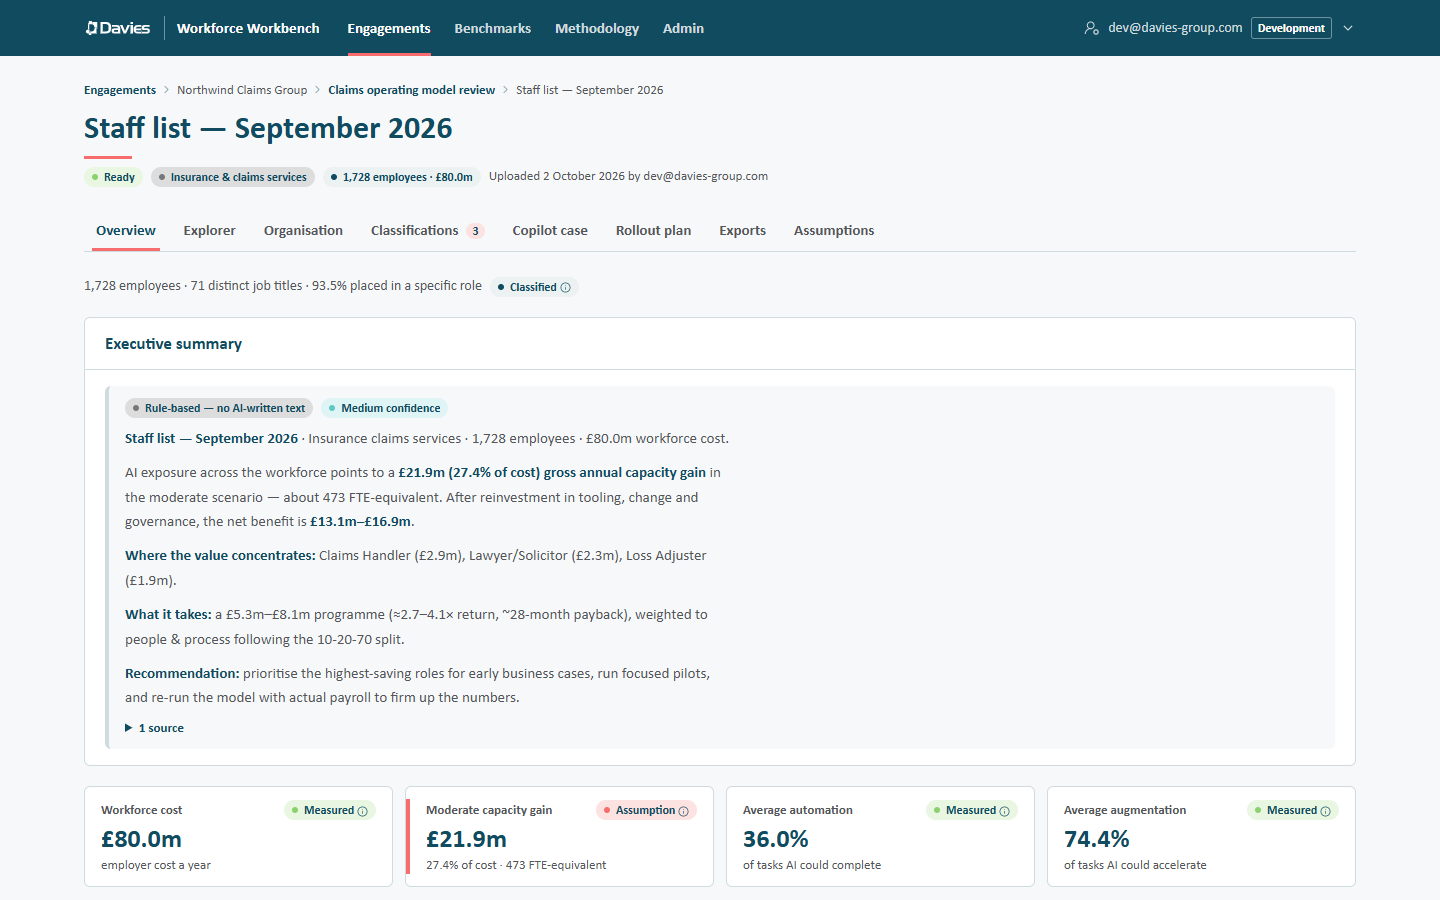
The line at the top reads, for example, 1,728 employees · 71 distinct job titles · 93.5% placed in a specific role. The last figure is the share of people whose title landed on a specific role rather than Other / Uncategorised.
Most figures carry a small badge (Measured, Calibration, Assumption and so on). Select it to see what the figure is and the chain of sources behind it. See Provenance and methodology.
Executive summary
A board-ready summary of the analysis. Every summary is framed and labelled:
- Rule-based — no AI-written text: a deterministic summary built from the figures. This is what we see until someone writes one with AI, and whenever AI isn't available. It opens with the staff list's name, sector, headcount and cost, then the capacity gain, where the value concentrates, what it takes and a recommendation.
- AI-generated: written by the AI from the staff list's anonymised aggregates only, with its confidence (High, Medium or Low confidence) and its sources. The only permitted source is the analysis itself (This analysis).
- Review before sharing appears when an AI summary has low confidence.
Leads and analysts see Write with AI (or Regenerate once there is one) when AI is configured. The result is cached for the staff list and shown to everyone, until the staff list is next rescored (an override, an assumption change, an industry pack change or a new reference data version), when it reverts to the rule-based text until regenerated.
If AI can't be used, a note explains why (for example, This month's AI budget (US$50) has been reached., where the figure is the platform's monthly budget in US dollars) and adds We kept the rule-based summary.
The executive summary prompt receives the staff list's name, the client's sector and aggregate figures: headcount, cost, average exposure, scenarios, net-of-reinvestment range, investment, top roles, cost by category, offshore and organisation figures. It never sees rows, employee IDs, names or emails, and it may not introduce numbers of its own. A response that doesn't cite the staff list is discarded in favour of the rule-based text.
Headline figures
| Tile | Meaning |
|---|---|
| Workforce cost | Total employer cost a year: salary × the employer-cost multiplier, summed. |
| Moderate capacity gain | The moderate scenario's gross annual capacity, as a share of cost and in FTE-equivalents. |
| Average automation | The average share of tasks AI could complete outright. |
| Average augmentation | The average share of tasks AI could accelerate. |
Money is shown compactly (£80.0m, £479k), shares to one decimal place (27.4%), and ranges with a dash and no spaces (£13.1m–£16.9m, 2.7–4.1×). The same formats are used in every deliverable.
AI capacity scenarios
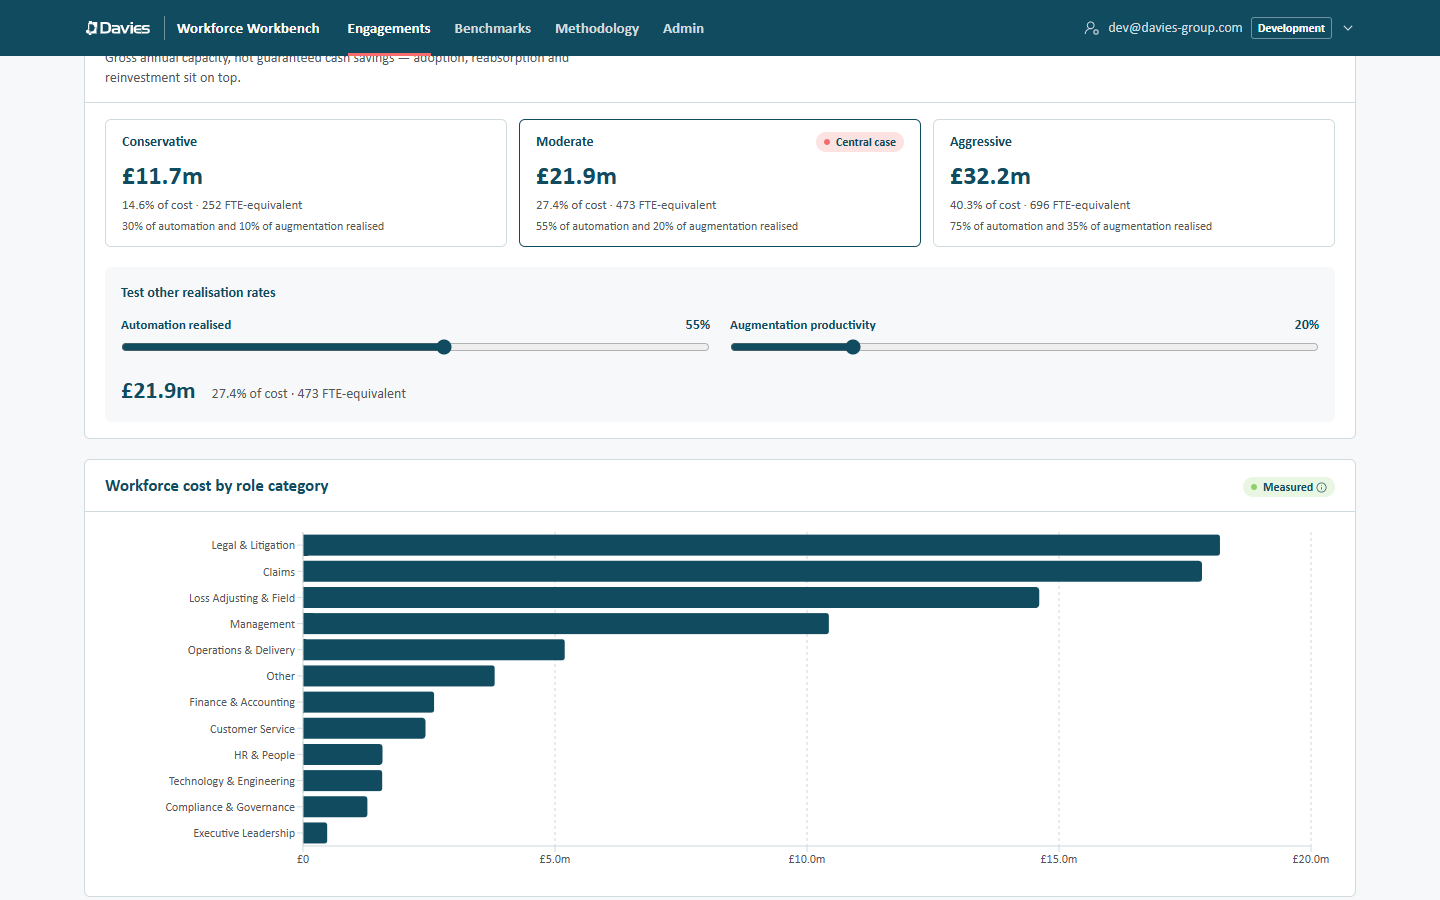
Three scenarios: Conservative, Moderate (the Central case) and Aggressive. Each shows the gross annual capacity, its share of cost, the FTE-equivalent, and the realisation rates behind it:
capacity gain = employer cost × ( automation × automation realised
                                 + (augmentation − automation) × augmentation productivity )
The card says what they are: These scenarios quantify potential annual productivity improvements and capacity creation rather than guaranteed cash savings, with realised value dependent on adoption, capacity utilisation and reinvestment choices. The HTML report and the deck use the same wording.
To see where a scenario's capacity lands by business, division, department or any grouping, use Savings by group; every grouping there adds up to the scenario's figure here.
Test other realisation rates has two sliders, Automation realised and Augmentation productivity, and shows the resulting capacity at once. It's a sandbox: nothing is saved, and the scenario presets themselves are reference data (see Assumptions).
Cost and where it sits
- Workforce cost by role category: a bar chart of the largest categories.
- By role category and By business (or By division when there's only one business): people, share, cost and average automation and augmentation for each group.
- Where the capacity concentrates: the top roles by moderate-scenario saving.
Value chain
Each role's time spread across the phases of the industry's value chain (for example, the claims lifecycle). See Value chain.
Against the published research
This workforce's average augmentation and automation in each benchmarked occupation group, beside the theoretical and observed AI coverage published for that group by Massenkoff & McCrory, Labor market impacts of AI (Anthropic, 2026). If no one falls in one of the six benchmarked groups, the card says so.
Adoption over time
The moderate scenario's FTE-equivalent capacity phased over nine half-years on an adoption S-curve (Foundation, Scale, Accelerate, Mature by default), starting from the half-year the staff list was created. The card explains that early benefits come gradually, accelerate as adoption grows and then level off as the organisation reaches a mature level of AI use.
Reinvestment and investment
- Net of reinvestment (moderate): the gross capacity gain, less the typical ranges reinvested in tooling, change and governance, leaving a Net benefit range.
- Investment programme: the programme cost range and ROI range for each scenario (for example 2.7–4.1×), Where the spend goes (BCG's 10-20-70: algorithms, technology and data, people and process) and Phasing (moderate) across four investment phases.
Offshore and GCC opportunity
Shown when relevant. The modelled saving is their employer cost today less the same roles at the lowest location factor in this staff list. The card adds that the estimate rests on a predefined set of desk-based roles and on modelling assumptions about delivery costs and role eligibility, and that it doesn't net off transition, management or attrition costs.
| Figure | Meaning |
|---|---|
| Already offshore | People in locations whose salary factor is below the offshore threshold (0.6 by default), and their cost. |
| Migration candidates | Desk-based, location-portable roles in high-cost locations (factor 0.9 and above by default). |
| Candidates' cost today | Their current employer cost. |
| Modelled migration saving | Their cost re-priced at the cheapest offshore factor in the staff list (0.25 when there's none). |
Ask this workforce
When AI is configured, the Overview ends with Ask this workforce. Type a question (at least three characters), for example Which roles should we prioritise for pilots?, and choose Ask. Answers:
- come from this analysis's anonymised figures only: the AI can't see names, rows or other engagements;
- are labelled, with confidence and sources, like the executive summary;
- say plainly when the figures can't answer the question, and suggest which view would help;
- are kept on screen for the last five questions, but not saved.
Any member of the engagement can ask, including viewers. Each question is metered against the monthly AI budget and recorded in the audit trail (the question's length, not its text).
Methodology and sources
The last card, Show where every number comes from, expands the full methodology panel: every metric, its basis and its sources, for the reference data version this staff list uses.