Savings by group
The Savings by group tab shows where a scenario's savings land in the client's own organisation: by business, division, department, role, location, tenant, or any extra grouping we mapped when we uploaded the staff list, such as an IFA firm or a region. It rescores the rows in the browser with the staff list's saved assumptions and reference data version, so it matches the report.
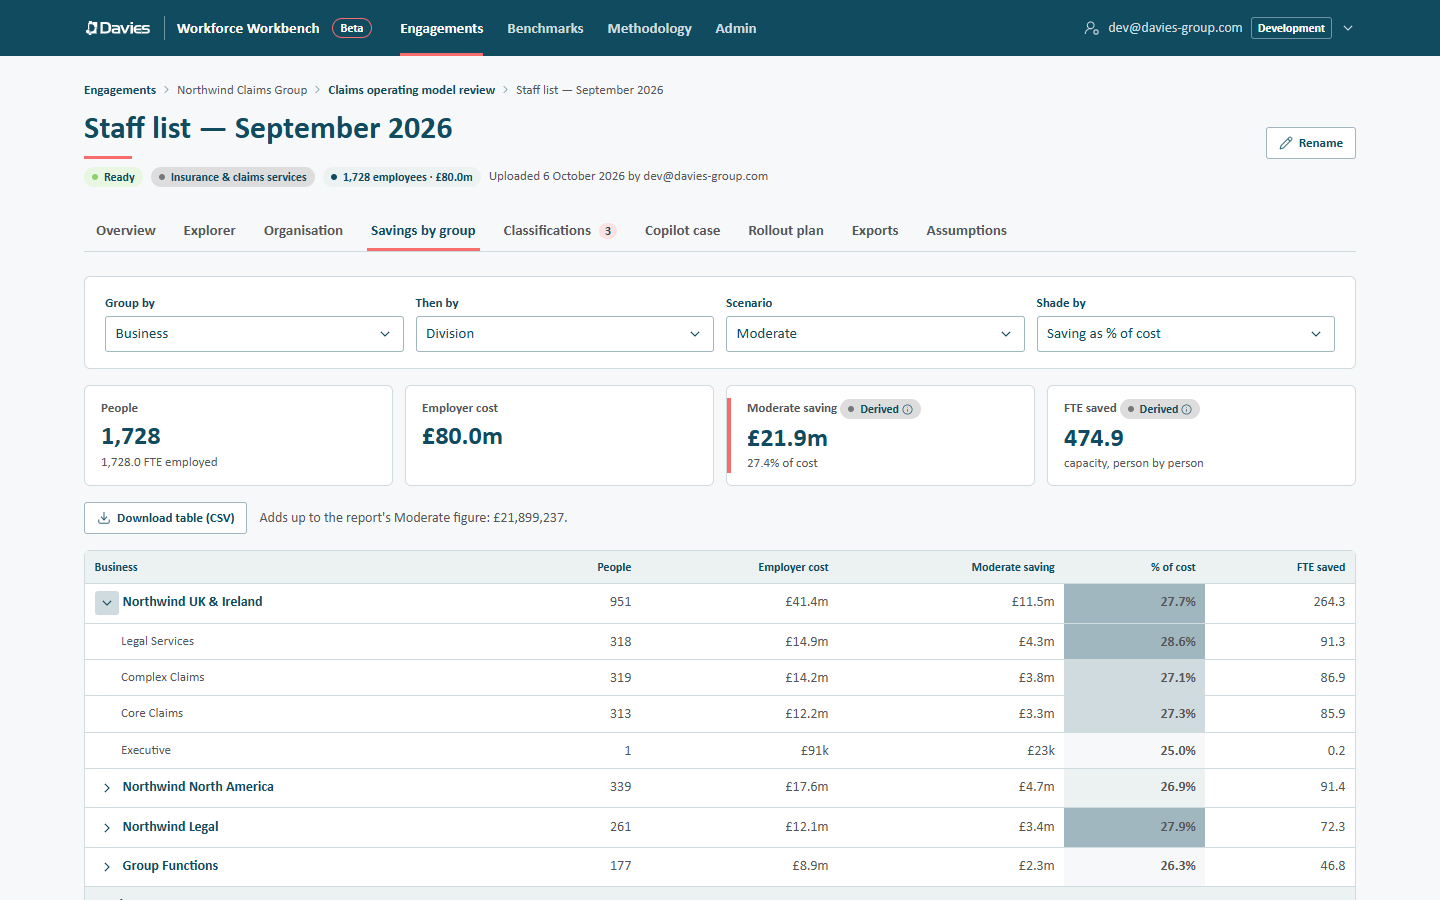
Choosing the view
| Control | What it does |
|---|---|
| Group by | The grouping for the rows. Only groupings the staff list has are offered. |
| Then by | Optional. A second grouping inside the first, such as Division then Department. Open a row's arrow to see its second-level rows. |
| Scenario | Conservative, Moderate or Aggressive. Moderate is the one the report headlines. |
| Shade by | What the heat map shows: Saving (£), Saving as % of cost or FTE saved. |
People with no value in a grouping appear as Not specified, last.
The table
| Column | Meaning |
|---|---|
| People | Headcount in the group. |
| Employer cost | What the group costs a year, from the salary benchmark or the client's own salaries, grossed up for employer costs. |
| Saving | The group's capacity gain in the chosen scenario: the sum of each person's employer cost × their saving multiplier. |
| % of cost | The saving as a share of the group's cost. This is the fairest column for comparing groups of different sizes. |
| FTE saved | The FTE of capacity the scenario releases: each person's saving multiplier × their FTE (1 when the staff list gives none), added up. |
The shading runs from the lowest to the highest value of the column chosen in Shade by, comparing each row with its peers: top-level rows with each other, and nested rows with the other rows in their group, so a part is never compared with a whole. It says which groups stand out, not how much is at stake; the figures say that.
Above the table, a line confirms that the total adds up (to within £1) to the report: Adds up to the report's Moderate figure: £X.. If the assumptions have changed since the staff list was scored, it shows both instead: The report shows £X for Moderate; this table adds up to £Y. Rescoring the staff list brings them back in line.
How it is worked out
Each person has a saving multiplier: the share of their employer cost that the scenario turns into capacity (automation × automation realised, plus augmentation beyond automation × augmentation productivity). People in the same role share a multiplier. A person's saving is their employer cost × their multiplier, so every grouping adds up exactly to the same total, whichever way we cut it.
FTE saved counts capacity person by person, so it follows headcount. The headline FTE-equivalent in the report divides the saving by the average employer cost, so it follows cost. They agree closely but are not identical, and neither is a headcount-reduction target. See Provenance and methodology.
Downloading the table
Download table (CSV) saves the rows shown, including the second-level rows and the total, with People, FTE employed, Employer cost, the saving, Saving % of cost and FTE saved with the scenario in brackets, for example FTE saved (Moderate). The download is recorded in the audit trail. It contains no names or emails, and nothing in this tab ever uses them.
For person-by-person figures, use the Explorer CSV, which carries each person's multiplier, saving, FTE and FTE saved beside their department and groupings.
Extra groupings and privacy
Extra groupings are categories. We refuse any column that looks like names, identifiers, people such as managers or advisers, emails or contact details, or that has so many different values it would identify individuals, in the browser before anything is sent and again on the server (the variety check when the upload completes). See Uploading a staff list for the full rules. They are held with each person's row, not in the report summaries, AI prompts, logs or benchmarks. See Preparing a staff list.