Provenance and methodology
Clients will challenge the numbers, so every figure in the Workbench is either derived from a cited source or labelled as an assumption we can see and change. Nothing reads as unexplained or "AI-generated".
Provenance badges
The small badge beside a figure names its basis. Select it (or focus it and press Enter) to see what the figure is, a plain-English note on how it's grounded, and the full list of sources with their edition, publisher, licence and a link.
| Badge | Meaning | Example |
|---|---|---|
| Measured | From published data. | The AIOE percentile behind an occupation's exposure; ONS ASHE full-time median pay. |
| Framework | An established external method. | BCG's 10-20-70 split (BCG frames it as effort; we apply it to spend). |
| Classified | Set by a disclosed rule or a human review. | A role's classification; its Copilot fit tier. |
| Calibration | A disclosed, tuned constant. | The 30%–85% augmentation band; the time-horizon cut-offs. |
| Derived | Computed from figures that are themselves sourced. | Capacity gain; FTE-equivalents; the saving multiplier and FTE saved; spans and layers; disconnected managers; the cost of managers; Copilot ROI. |
| Assumption | A judgement we can change. | Location factors; scenario realisation rates; the employer-cost multiplier; the Copilot licence price; the realism discount; the narrow and wide span thresholds. |
Assumption badges are salmon-marked, so they stand out in a review.
The Methodology page
Methodology in the top bar explains the whole model with the numbers from the reference data currently in use. Its header reads, for example, Reference data version 2, published 2 October 2026.
- The pipeline: six steps, from reading the staff list to valuing Copilot, each quoting the live constants (the review threshold, the exposure band, the AEI automation share, the employer-cost multiplier, the scenario presets and the Copilot fit shares).
- Industry packs: each pack's description and number of overlay rules.
- Where every number comes from: every metric, its basis, its qualifier and its sources.
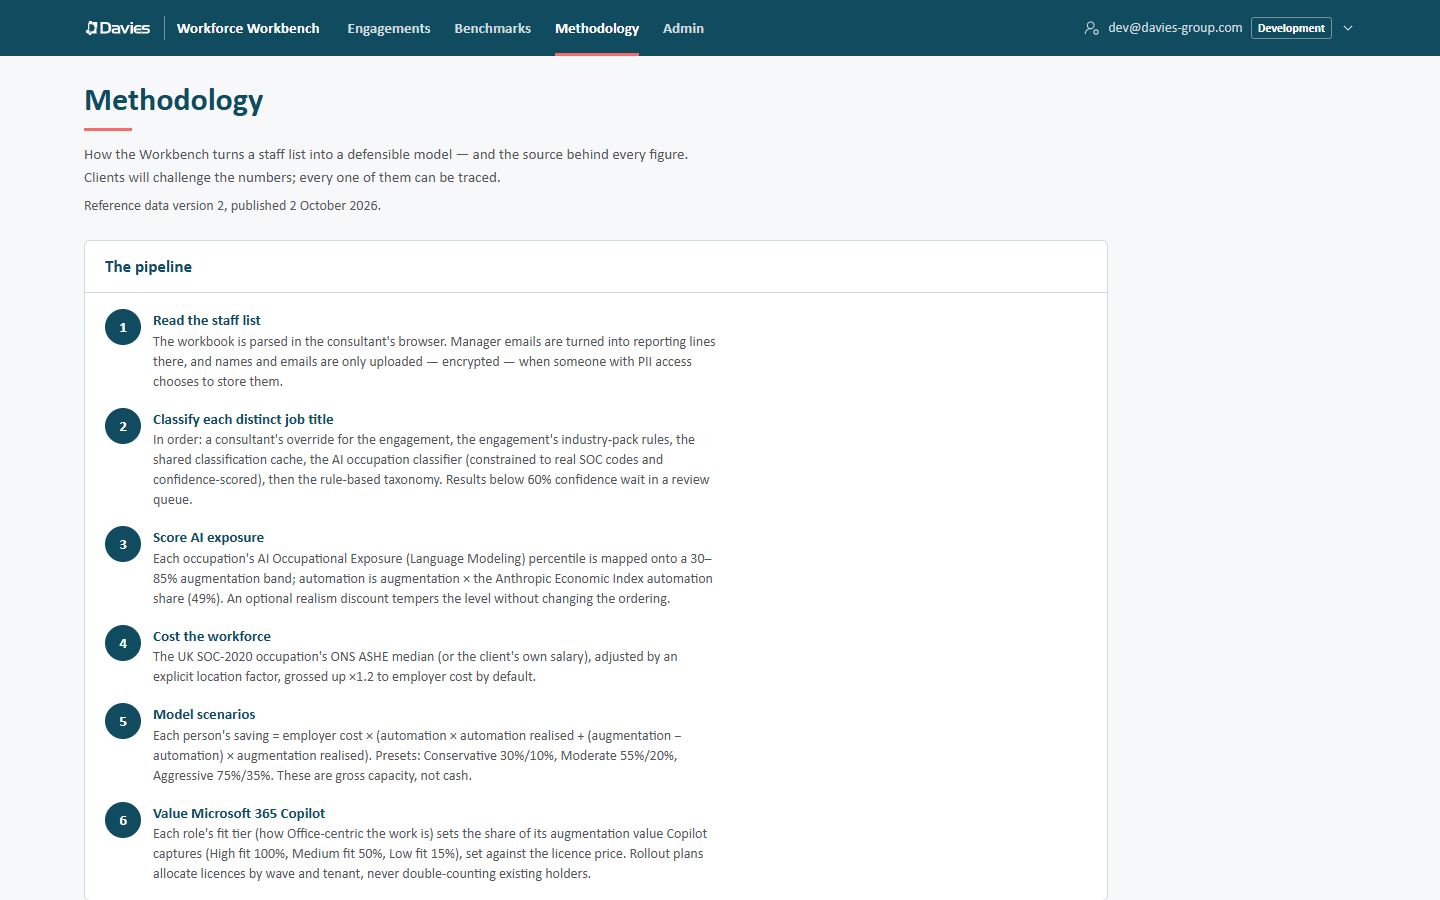
The same methodology appears on every staff list's Overview (Show where every number comes from) and at the end of every report and workbook, for the reference data version that staff list was scored with.
How the figures are derived
A summary; the Methodology page has the detail with live values.
-
Classification. Each distinct title is classified once, to a US SOC-2018 occupation, a UK SOC-2020 occupation and a Workbench role, by override, industry pack, shared cache, AI or rules, in that order. See Classifications and overrides.
-
Exposure. Anchored to two published measures joined on US SOC-2018:
- the AI Occupational Exposure (AIOE), Language Modeling index (Felten, Raj & Seamans). Each occupation's percentile maps linearly onto an augmentation band of 30% to 85%: the share of the role's work AI can assist. The published scores use SOC 2010 codes, so we crosswalk them to SOC 2018 with the official BLS crosswalk (averaging where several 2010 codes merge into one) and work out the percentiles ourselves over the crosswalked set;
- the Anthropic Economic Index (June 2026 release, Claude.ai conversations in May 2026): of the conversations classified as automation or augmentation, 48.6% were automation, so automation = augmentation × 0.486, the share of work AI could perform outright.
The percentile (and so the ordering of roles) is measured; the band is a disclosed calibration; automation is derived. About 67 SOC 2018 occupations have no AIOE score (military, "All Other" residual codes, Data Scientists and Legislators). Roles with no published exposure row fall back to the Workbench's own rubric, labelled as an assumption. The optional realism discount scales both down without changing the order.
-
Cost. The client's base salary where supplied; otherwise the ONS ASHE median for full-time jobs (2025 provisional) for the role's UK occupation × the location factor. Employer cost = salary × 1.20 by default: an assumption that allows for pension and benefits above the statutory minimum, which alone (employer National Insurance and the auto-enrolment minimum, 2026/27) comes to about ×1.14–1.16.
-
Scenarios. Capacity gain = employer cost × (automation × automation realised + (augmentation − automation) × augmentation productivity). Conservative 30%/10%, moderate 55%/20%, aggressive 75%/35%, taken from Davies' internal "AI Impact on COGS" deck and labelled as assumptions. FTE-equivalent = capacity gain ÷ average employer cost. Gross annual capacity, not cash.
Each person's saving multiplier is the bracket on its own: the share of their employer cost the scenario turns into capacity. Everyone in a role shares it, and a person's saving is their employer cost × their multiplier, so savings grouped by any field (a division, a department, an IFA firm) add up exactly to the scenario's total. FTE saved = saving multiplier × the person's FTE (1 when the staff list gives none), added up for a group. It follows headcount, where the FTE-equivalent follows cost, so the two agree closely but not exactly. The staff list's FTE never changes a person's cost: the salary is taken as the cost of the post. Neither figure is a headcount-reduction target. See Savings by group.
-
Report models. The adoption S-curve (nine half-years: 5%, 15%, 28%, 42%, 56%, 70%, 85%, 92%, 100%), reinvestment (23%–40% of the gross gain), the investment programme (ROI bands per scenario, split 10-20-70, phased 12%/26%/33%/29%, 28-month indicative payback), the value chain and the offshore view.
-
Organisation. Spans, layers and roll-ups from reporting lines. Where a span counts as narrow (2 or fewer) or wide (15 or more) is a disclosed convention, labelled an assumption. Disconnected managers are counted from the manager column: people whose manager isn't in the staff list, with an indicative adjustment that adds each missing manager back as one person, so its layers are a minimum. The cost of managers is what they cost today, not a saving. See Organisation and the Spans and layers report.
-
Copilot. Benefit = employer cost × value base × productivity × fit share, against £23.10 a user a month (Microsoft's UK enterprise list price, paid yearly, excluding VAT). See Copilot business case.
All constants quoted are the built-in defaults; administrators can publish different values as reference data.
Sources of record
| Source | Used for |
|---|---|
| Felten, Raj & Seamans (2021, 2023), AI Occupational Exposure (Language Modeling) | Augmentation exposure by occupation |
| US Bureau of Labor Statistics, SOC 2010 to SOC 2018 crosswalk | Re-keying AIOE to SOC 2018 |
| Anthropic Economic Index, June 2026 release (Claude.ai) | Automation share of AI use |
| Massenkoff & McCrory, Labor market impacts of AI (Anthropic, 2026) | Research benchmarks by occupation group |
| US Bureau of Labor Statistics, SOC 2018 | The exposure join key |
| Office for National Statistics, SOC 2020 and ASHE 2025 provisional (full-time) | The salary join key and median salaries |
| HM Revenue & Customs (employer National Insurance); The Pensions Regulator (auto-enrolment minimums), 2026/27 | Context for the employer-cost assumption |
| Boston Consulting Group, 10-20-70 principle | The investment split |
| McKinsey (Chui et al., 2023); Eloundou et al., GPTs are GPTs | Context for exposure ranges |
| Microsoft, Microsoft 365 Copilot UK enterprise list price | The default licence price |
| Client data | Headcount, structure, locations, salaries where supplied |
| Workbench assumptions (scenario rates from Davies' internal "AI Impact on COGS" deck) | Scenario rates, employer-cost multiplier, location factors, realism discount, reinvestment, ROI bands, payback, fit shares, value model; always labelled as assumptions |
The register itself is reference data (Sources of record), so administrators record each new edition when they load new data.
Reference data versions
Every table and constant above is reference data: versioned, and published by administrators. Three rules keep figures reproducible:
- Published versions never change. A correction is a new version.
- A staff list is pinned to the version that was current when it was uploaded, and is always scored with it, in the browser and on the server.
- New versions don't move existing figures until someone chooses to.
When a newer version is published, a finished staff list shows:
Reference data version N is available. This staff list is scored with version M. Rescoring applies the newer tables and constants; classifications from the AI and overrides are kept, and no AI is called.
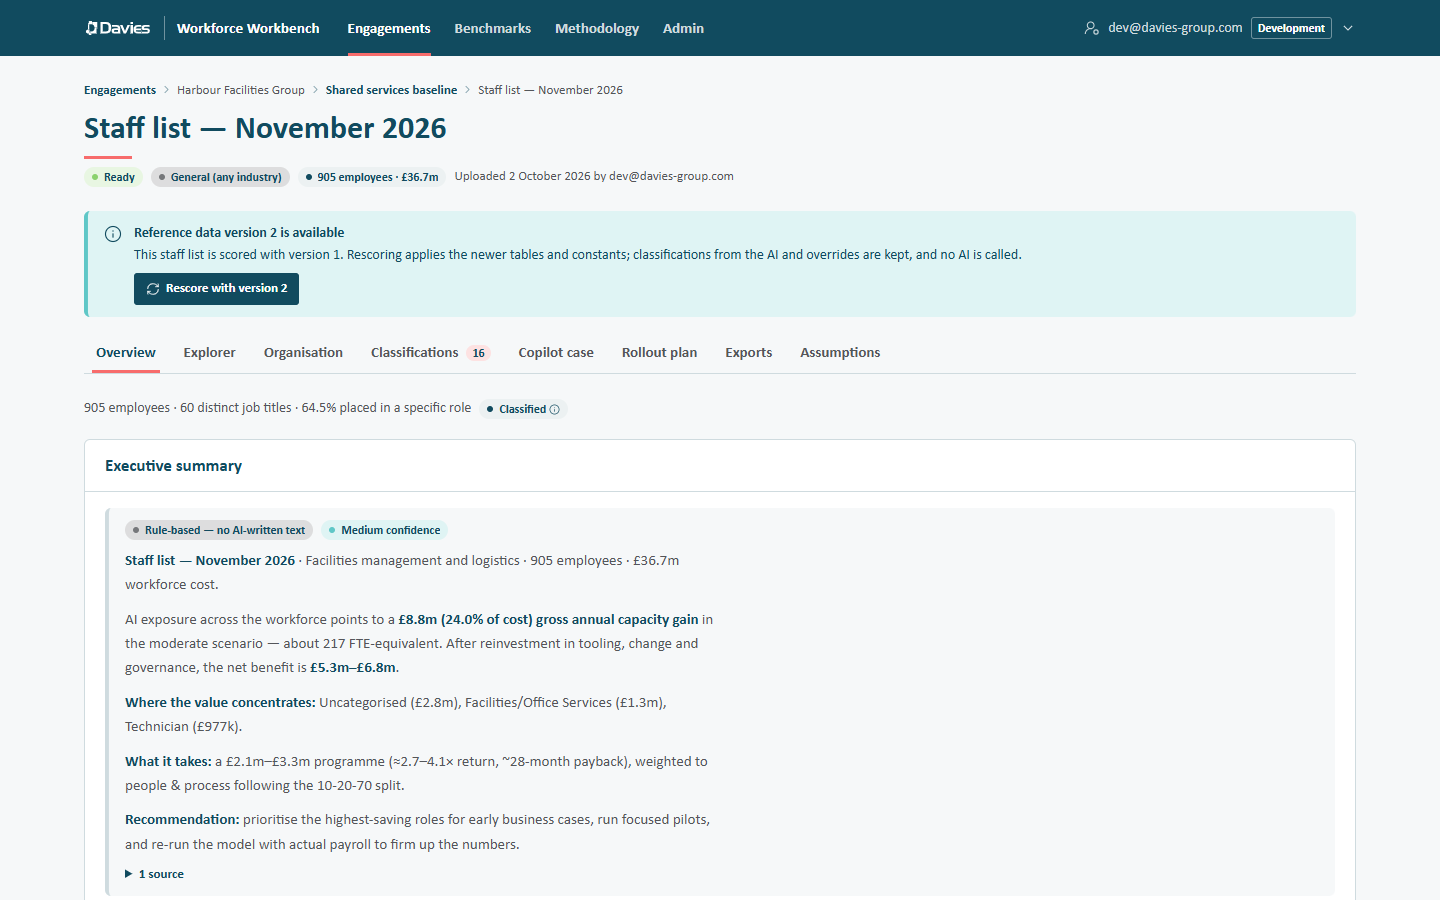
Leads and analysts see Rescore with version N while the engagement is active. Rescoring:
- re-applies overrides and industry-pack rules as the new version defines them;
- keeps the staff list's own AI and shared-cache classifications whose codes still exist in the new version, and falls back to the new rules for any that don't;
- rescores every row and rebuilds the summary, and clears cached AI text;
- records Rescored with new reference data in the audit trail, with the old and new version numbers.
Export the current deliverables first. Rescoring can move figures, and the older version's numbers are then only reproducible by rescoring back through an administrator.
An override is only accepted if every reference data version pinned by a staff list holding the title knows the chosen code or role. If one doesn't, the override is refused with a message suggesting a rescore first. See Classifications and overrides.