Organisation
The Organisation tab builds the organisation chart from each person's manager and measures its shape. It needs reporting lines: map a Manager's employee ID or Manager's email column when uploading. Without either, the tab says No reporting lines in this staff list.
Headline figures
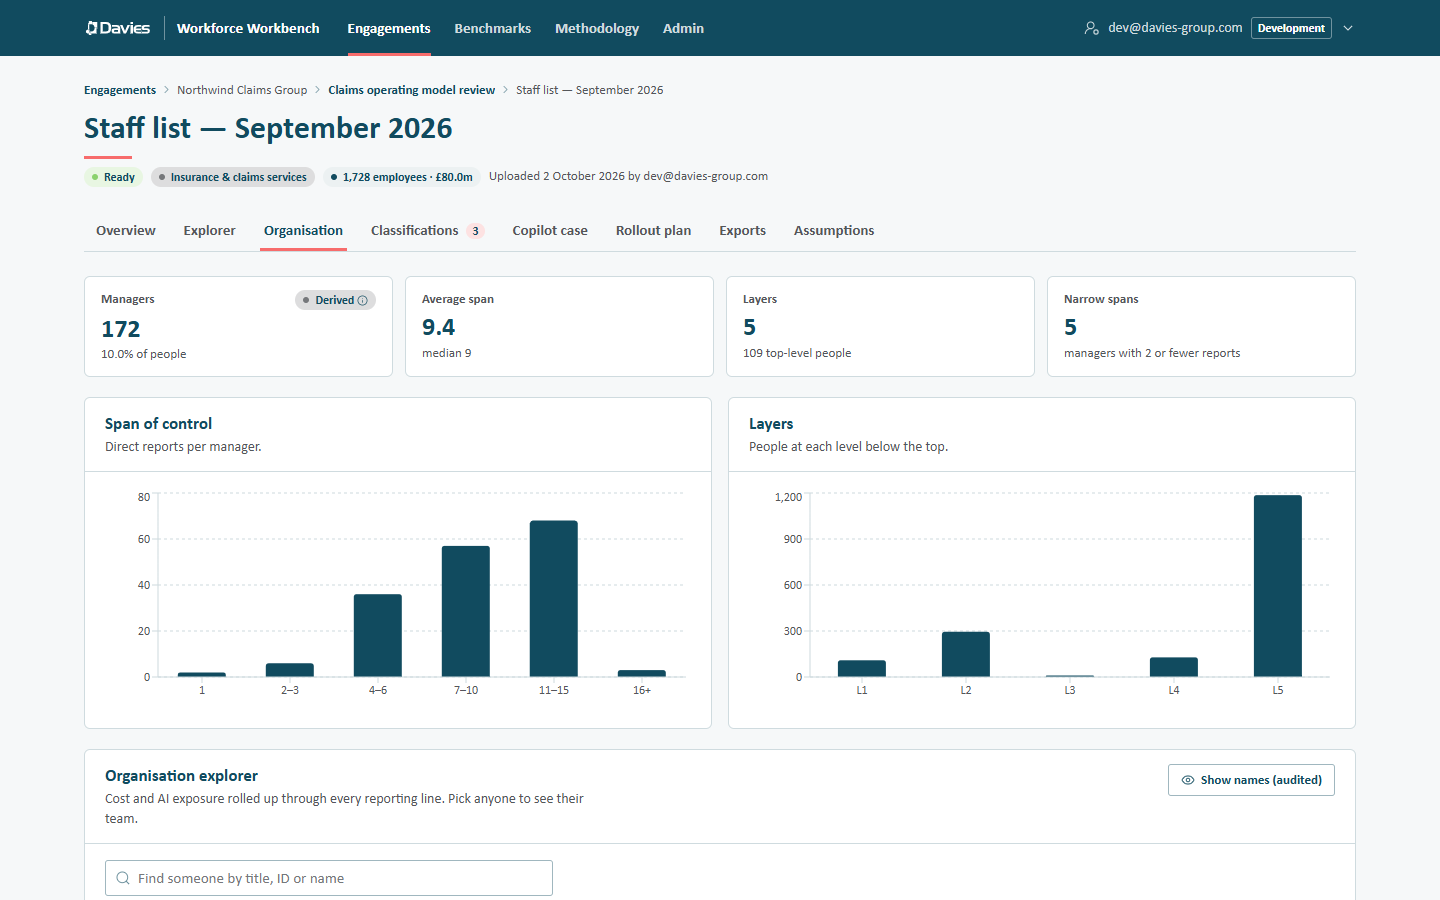
| Tile | Meaning |
|---|---|
| Managers | People with at least one direct report, and their share of the workforce. |
| Average span | Average direct reports per manager, with the median. |
| Layers | The depth of the deepest reporting line, and how many people sit at the top level. |
| Narrow spans | Managers with 2 or fewer direct reports (the built-in threshold). |
A note appears when the data needed repair:
- N people report to a manager who isn't in this list, so they appear as top-level. This is common when a staff list is filtered (for example to active employees) or covers part of a group.
- We broke N reporting loops in the data. Circular reporting lines (A reports to B, B to A) are broken so the tree can be built.
Either note ends: The Spans and layers report on Exports shows how far this could move the figures. See Spans and layers report.
Span of control and layers
- Span of control is a bar chart of managers by number of direct reports: 1, 2–3, 4–6, 7–10, 11–15 and 16+. Spans of 15 or more count as wide (built-in threshold).
- Layers shows how many people sit at each level below the top (L1, L2, …).
Organisation explorer
Cost and AI exposure rolled up through every reporting line. Pick anyone to see their team.
- Find someone by title, ID or name to jump to a person.
- The reporting tree on the left expands and collapses.
- The panel on the right shows the chosen person with their reporting chain (select any name in it to go up a level), and the roll-up for their whole reporting line: Team (headcount), Team cost, Average automation and Managers inside. Their direct reports are listed below.
People are labelled by job title (or employee ID) unless names are revealed. With stored names and PII access, Show names (audited) decrypts every name in the staff list for the tree; it's recorded in the audit trail with the purpose Organisation chart: show names.
Narrow spans
The Narrow spans table lists managers with 2 or fewer direct reports, most expensive first: each Manager with their Business, Layer, Direct reports, Team size and Employer cost. These are often worth a look when redesigning layers.
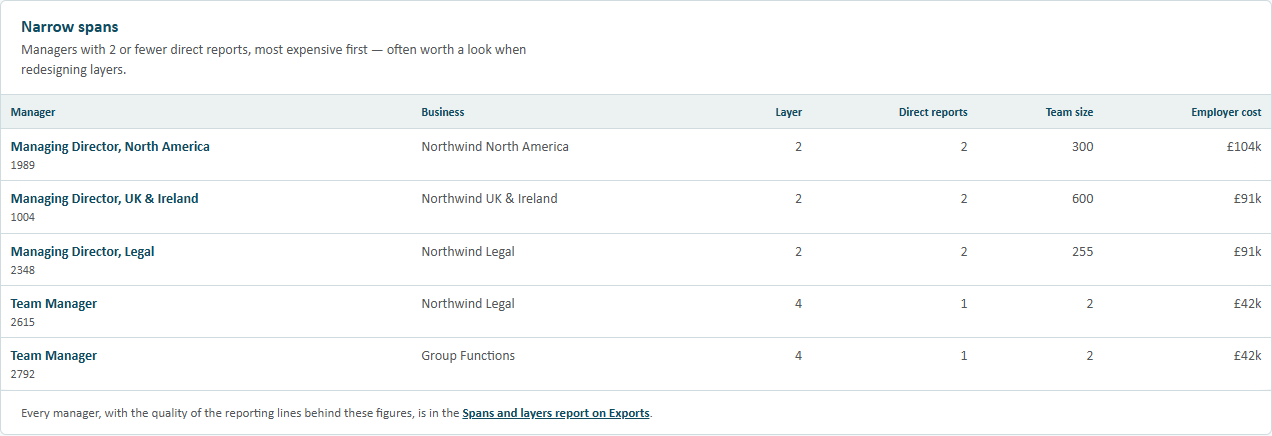
The tab shows only the 15 most expensive, and says how many more there are (The 15 most expensive of N are shown). Every manager, with the quality of the reporting lines behind these figures, is in the Spans and layers report on Exports.
How it's built
- Reporting lines come from the manager's employee ID, or from the manager's email resolved to an employee ID in the browser at upload.
- Where an employee ID appears more than once, the organisation chart uses the first row with it.
- Where a manager email is shared by several people, the reporting line is left unlinked rather than guessed.
- Where a manager is named by email but isn't in the list, we keep an opaque numbered stand-in for them (never the email), shared by everyone who named them, so they still count as reporting to a missing manager. This applies to staff lists uploaded from now on; earlier lists show those people as having no manager.
- Spans and layers feed the benchmarks and, where there's a hierarchy, the AI executive summary's facts.
- The narrow and wide span thresholds are reference data (Exposure, scenarios and thresholds in Reference data).
The org structure's provenance is Derived: computed from the client's reporting-line data.