Exports
The Exports tab produces every deliverable for a staff list. Each is generated in the browser from the staff list's summary and rescored rows, in the Davies brand or, when the client has one, co-branded or in the client's own brand (see Brand). The server never renders documents, and nothing leaves the platform except the file we download.
Every export is recorded in the audit trail (Exported, with its format, deliverable and brand). None contains names or emails; the only deliverable that can is the Copilot allocation workbook on the Rollout plan tab.
Brand
The Brand card at the top of the tab decides how every HTML report, PowerPoint deck and Excel workbook made there looks. CSV files carry no styling.
| Choice | What the deliverable shows |
|---|---|
| Davies | Davies colours, Calibri and the Davies logo. The Davies logo tick box on the report card can leave the logo off a report. |
| Co-branded with the client | The client's colours, font and logo lead. The Davies logo and Prepared by Davies appear on the cover, and the Davies logo sits in each slide's footer. |
| The client's brand | The client's colours, font and logo throughout. Davies appears only in a Prepared by Davies credit. |
The client options are available once the client has a brand (see Client brand); until then the card says so and links to the engagement's Settings tab. We remember the choice for each engagement in this browser, and the Rollout plan tab's Brand list shares it.
Layouts, provenance badges, AI labels and figures are the same in every brand: only colours, font and logos change. Excel workbooks show the client's logo at the top right of their first sheet; Davies workbooks have no logo.
At a glance
| Deliverable | Format | Needs row-level data | Where |
|---|---|---|---|
| Workforce AI impact report | HTML (self-contained), print to PDF, Markdown | Only for the interactive explorer | Exports |
| Workforce AI impact deck | PowerPoint | No | Exports |
| Finance workbook | Excel with live formulas | Yes | Exports |
| Copilot business case | HTML | Yes | Exports |
| Summary CSV | CSV | No | Exports |
| Row-level CSV | CSV | Yes | Explorer |
| Copilot allocation workbook | Excel | Yes | Rollout plan |
| Copilot deployment deck | PowerPoint | Yes | Rollout plan |
"Needs row-level data" means the export is unavailable once the engagement's personal data has been purged (Needs row-level data, which has been purged.).
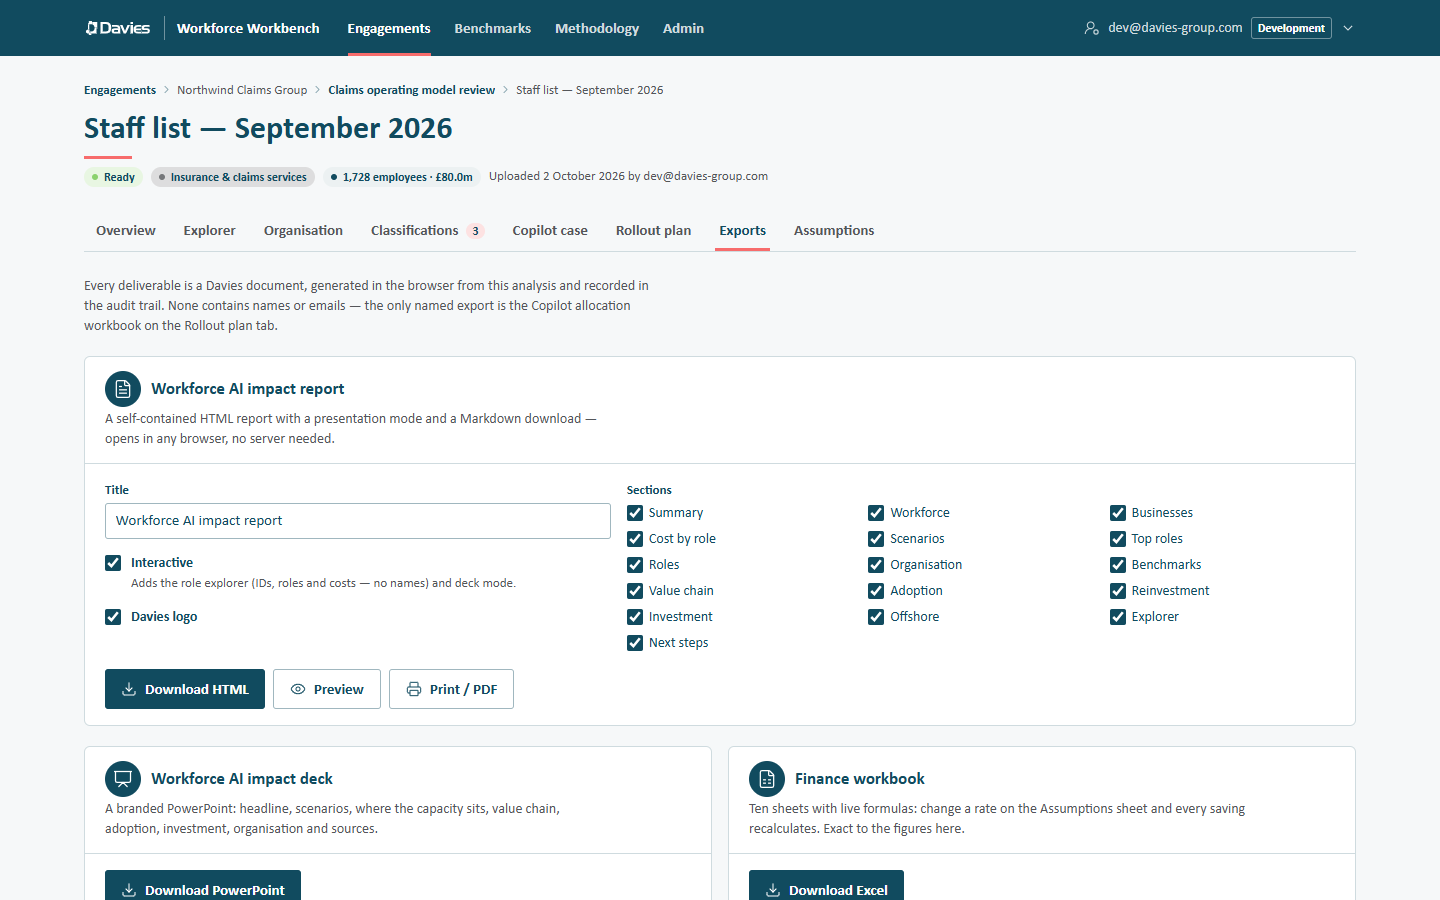
Workforce AI impact report
A self-contained HTML report with a presentation mode and a Markdown download — opens in any browser, no server needed.
Options:
- Title: Workforce AI impact report by default.
- Interactive: Adds the role explorer (IDs, roles and costs — no names) and deck mode. Unavailable after a purge.
- Davies logo: include the white logo on the cover.
- Sections: tick the sections to include: Summary, Workforce, Businesses, Cost by role, Scenarios, Top roles, Roles, Organisation, Benchmarks, Value chain, Adoption, Reinvestment, Investment, Offshore, Explorer, Next steps.
Actions:
| Button | What it does |
|---|---|
| Download HTML | Saves one .html file that opens offline and can be emailed. |
| Preview | Opens the report in a new browser tab. |
| Print / PDF | Opens the browser's print dialog; choose Save as PDF. The interactive explorer is left out of print. |
Inside the downloaded report, floating buttons offer Markdown (a Markdown copy of the text), Present (presentation mode) and PDF (print). In presentation mode, use the arrow keys or space to move between slides, the drop-down to jump, and Escape or Exit to leave.
The report reads well on a phone too: wide tables scroll sideways rather than squeezing, and the floating buttons don't cover the text.
Your own wording
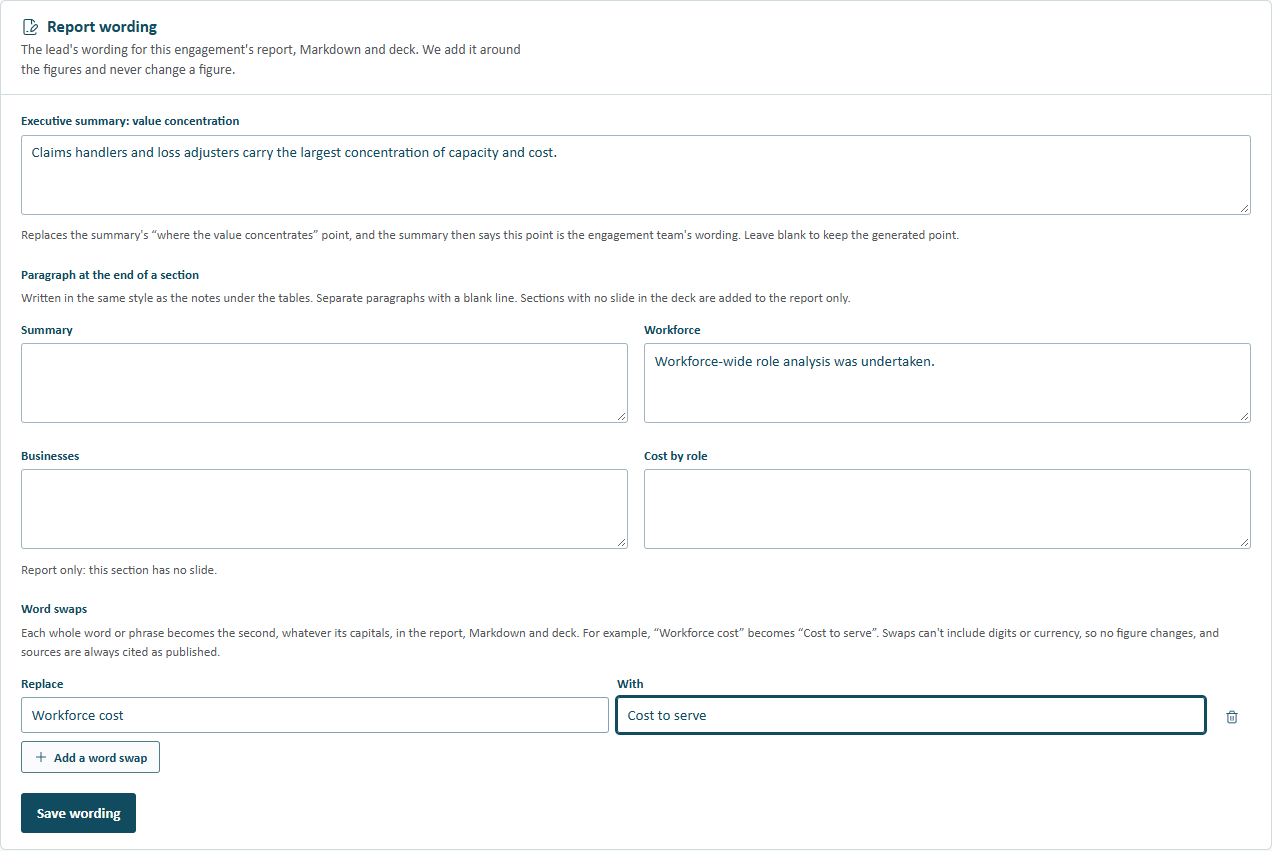
The engagement lead can add the engagement's own wording on the engagement's Settings tab, under Report wording. It is added around the figures and never changes them.
| Wording | Where it appears |
|---|---|
| Executive summary: value concentration | Replaces the summary's Where the value concentrates point (or an AI-written Value concentration point). If the summary has no such point, it is added at the end. |
| A paragraph at the end of a section | Under the section's other notes, in the same style, in the HTML report and its Markdown. In the deck, it is a slide straight after the section's slide. Sections the deck has no slide for (Businesses, Roles, Benchmarks, Reinvestment, Explorer) appear in the report only. Separate paragraphs with a blank line. |
| Word swaps | Every use of the first wording becomes the second, in the text of the report, its Markdown and the deck. Capitals matter. For example, Workforce cost becomes Cost to serve. Tags, attributes and scripts are never touched. |
Only the lead can change it, while the engagement is active. Changes are recorded in the audit trail without copying the wording into it.
The report includes the executive summary (the AI-written one if it exists, otherwise the rule-based one, labelled either way), the value chain (including an AI map when there is one) and a full methodology and sources section.
Teams and Outlook preview HTML attachments in a sandbox without scripts. The report detects this and asks the reader to download the file and open it in a browser, where the interactive parts work.
Spans and layers report
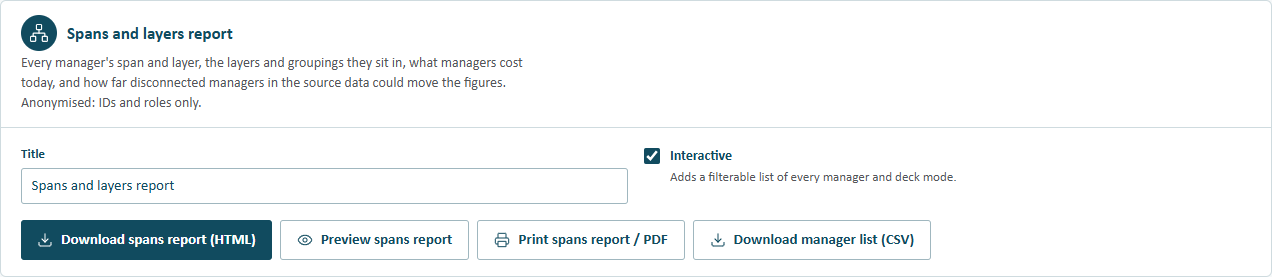
Every manager's span and layer, the layers and groupings they sit in, what managers cost today, and how far disconnected managers in the source data could move the figures. Anonymised: IDs and roles only. It needs the staff list's rows, so it is unavailable after a purge.
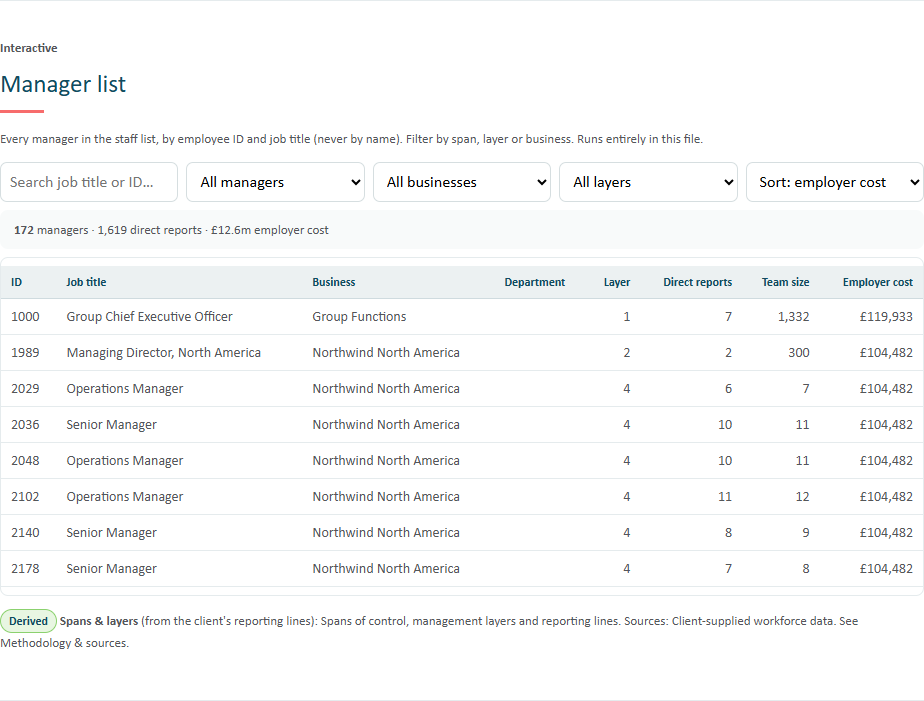
Options: a Title, and Interactive, which adds a filterable list of every manager and presentation mode. Buttons: Download spans report (HTML), Preview spans report, Print spans report / PDF and Download manager list (CSV).
| Section | What it shows |
|---|---|
| Summary | People, managers, average and median span, layers, narrow and wide spans, and how to read them. |
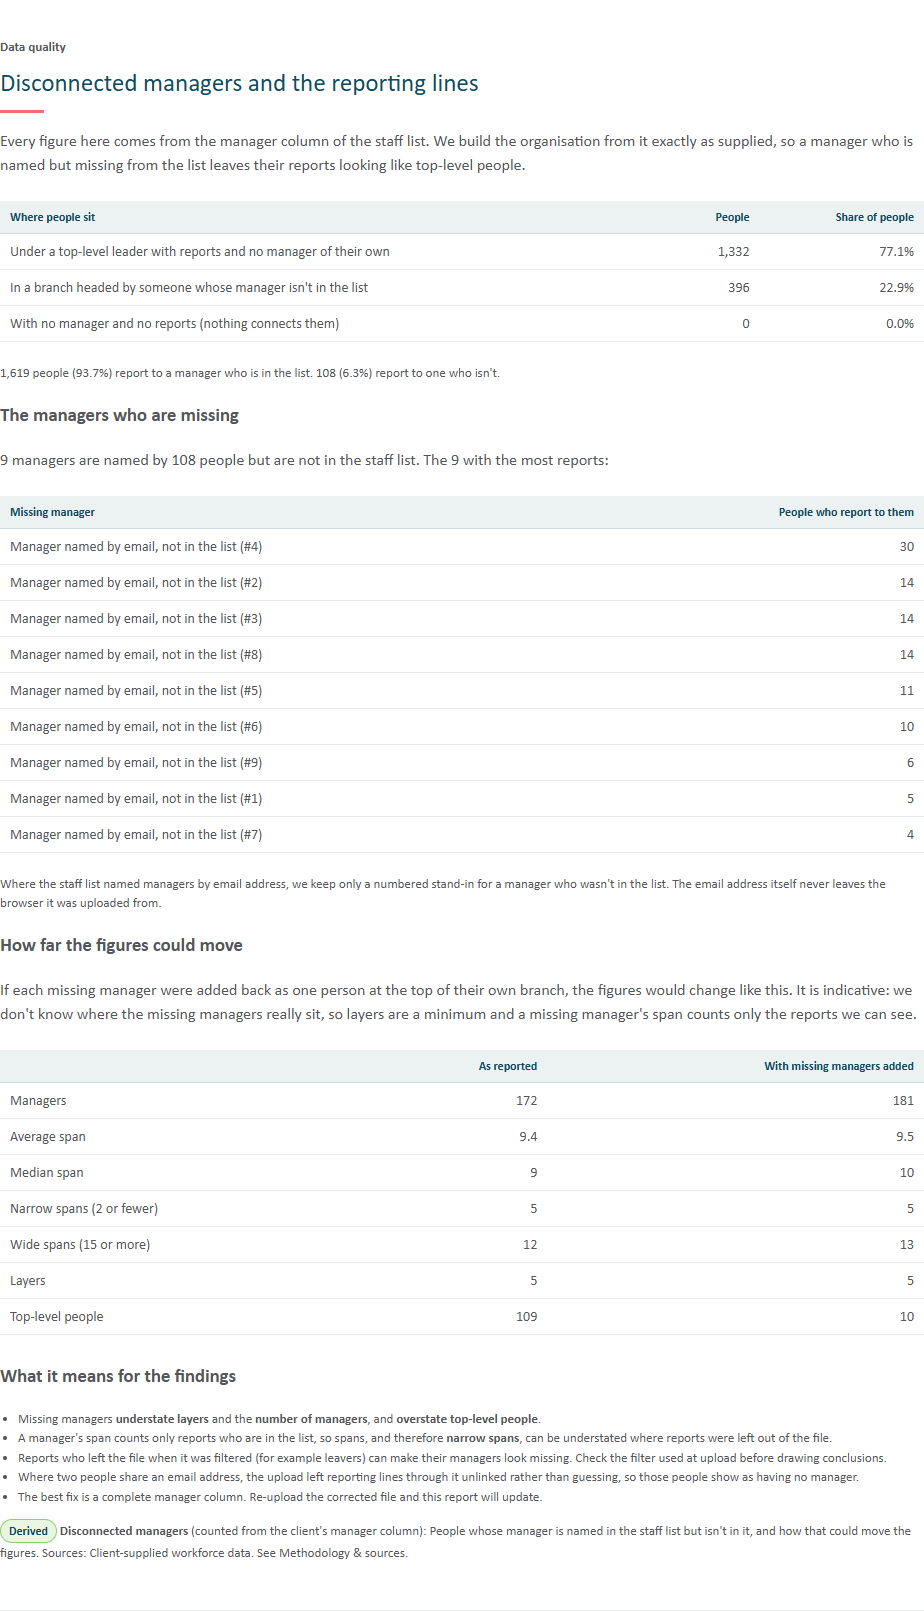
| Data quality | How many people connect to a manager in the list, and how many name a manager who isn't in it (disconnected managers), with the missing managers and their reports. Then how far the figures could move if each missing manager were added back, and what that means for the findings. |
| Spans | Managers and direct reports by band, and the narrow and wide counts. |
| Layers | People, managers, average span and average employer cost at each layer. |
| By group | The same by business, division and department, where the staff list has them. |
| Cost | What managers, narrow-span managers and one-report managers cost today. It is a cost, not a saving. |
| Managers | Every manager with layer, direct reports, team size and employer cost, filterable by narrow, one report, wide, layer and business. |
| Methodology | Every figure's basis and sources. |
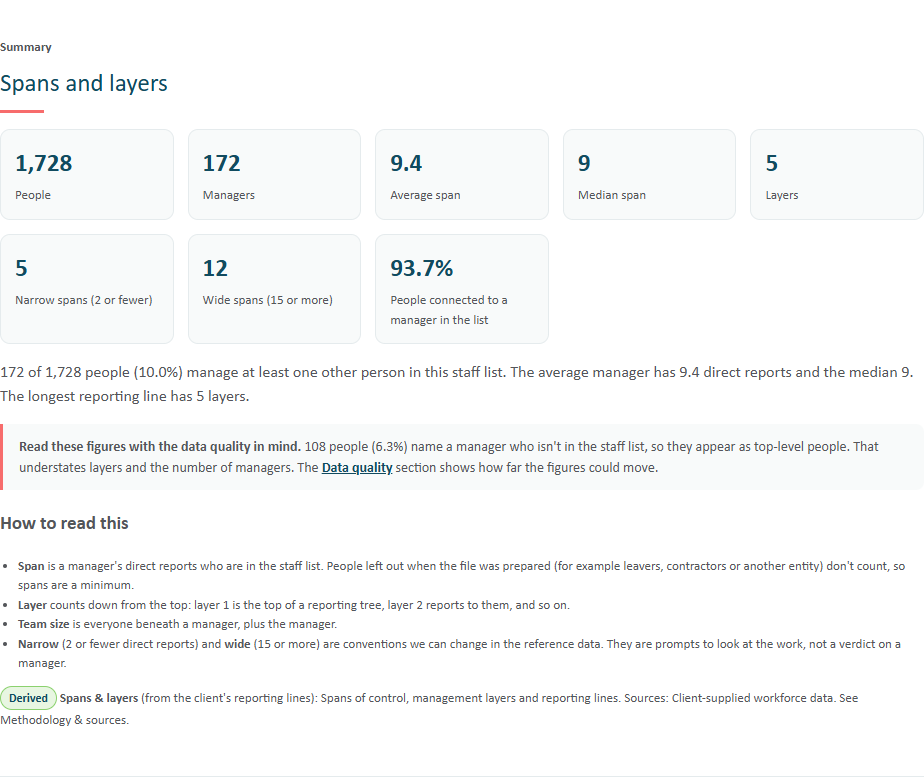
Every section ends with the basis of its figures (Derived from the client's reporting lines, or an Assumption for the narrow and wide thresholds) and the sources behind it, and points to the full Methodology & sources section.
A manager who is named but missing from the staff list leaves their reports looking like top-level people. That understates layers and the number of managers. A manager's span counts only the reports who are in the list, so narrow spans can also be overstated where reports were left out of the file (leavers, for example). The report quantifies the first of these, and says plainly that where missing managers really sit is unknown, so its adjusted layers are a minimum.
The manager list (CSV) has one row per manager (employee ID, job title, business, division, department, location, layer, direct reports, team size, employer cost and whether the span is narrow or wide). It never contains names.
Workforce AI impact deck
A branded PowerPoint: headline, scenarios, where the capacity sits, value chain, adoption, investment, organisation and sources. Download PowerPoint.
The deck uses the Davies master: the white logo on a teal title slide, Calibri throughout and brand-ordered chart series. It includes the AI executive summary when there is one. Its value-chain slide uses the rule-based lens, not an AI map.
Finance workbook
Ten sheets with live formulas: change a rate on the Assumptions sheet and every saving recalculates. Exact to the figures here. Download Excel.
| Sheet | Contents |
|---|---|
| Raw Data | Every person (by employee ID, never name), with classification, exposure, salary and employer cost, then their saving as a cost multiplier, FTE, FTE saved and any extra groupings. |
| Assumptions | Scenario rates and the employer-cost multiplier. The highlighted cells are the only editable ones. |
| By Role Category | Cost and modelled savings by role category. |
| By Business | Cost and modelled savings by business or root division. |
| By Division, By Department, By (a grouping) | The same, with FTE saved, for each of these the staff list has: division, department and each extra grouping such as an IFA firm. Each adds up to the same total. |
| By Role | Cost and savings by role. |
| SOC Mapping | How each role maps to occupations and salaries. |
| Scenario Comparison | The three scenarios side by side. |
| Projection | The adoption S-curve over time. |
| Locations & GCC | Headcount and cost by location, and the offshore view. |
| Methodology & Sources | How every figure is derived, and its sources. |
Every saving is a live formula that traces back to the Assumptions sheet. Change a scenario rate or the employer-cost multiplier there and the workbook recalculates, so a client's finance team can test their own assumptions. With the saved assumptions, its figures match the platform exactly.
Group totals match names exactly, so groups whose names differ only in capitals (Sales and SALES) or contain spreadsheet wildcards such as * are totalled separately rather than double-counted, as in the app. The Locations & GCC sheet quotes the reference data's offshore threshold and the location factor people were priced at.
Copilot business case
Fit tiers, benefit against licence cost and where licences land first — optionally with a saved rollout plan's waves by tenant.
- Include a rollout plan: choose a saved plan, or No plan — default assumptions.
- Download HTML. Disabled once the personal data has been purged (it needs row-level data).
With a plan, the report uses the plan's saved Copilot assumptions and adds its waves by tenant. Without one, it uses the reference data defaults (not whatever was last tried on the Copilot case tab). It includes an interactive role explorer by employee ID.
Data extracts
Summary rollups and scenarios (with the workforce cost and number of role categories) as CSV. Row-level extracts are on the Explorer tab. Summary CSV contains:
- headcount, employer cost and average automation and augmentation by role category, business, division and tenant;
- the three scenarios with their realisation rates, gross saving, share of cost and FTE-equivalent.
CSV cells that a spreadsheet would treat as a formula are neutralised.
Provenance in every deliverable
Every report and workbook ends with a methodology and sources section generated from the same provenance data as the app's badges, for the reference data version the staff list uses. See Provenance and methodology.
Step by step: Prepare a client pack.